Aggregates Sizer - Features
Aggregation Analysis System for Biopharmaceuticals
Principle of measurement
Why can particle size distribution as a concentration be measured using the laser diffraction method?
This figure shows scattered light intensity data when the same samples have been measured under the different concentration conditions.
Relationship patterns between the sensor element number and light intensity are similar, and the respective light intensity detected by the sensor element of Wing sensor II is proportional to the concentration.
Previously, normalized particle size distribution could not be obtained as a concentration.
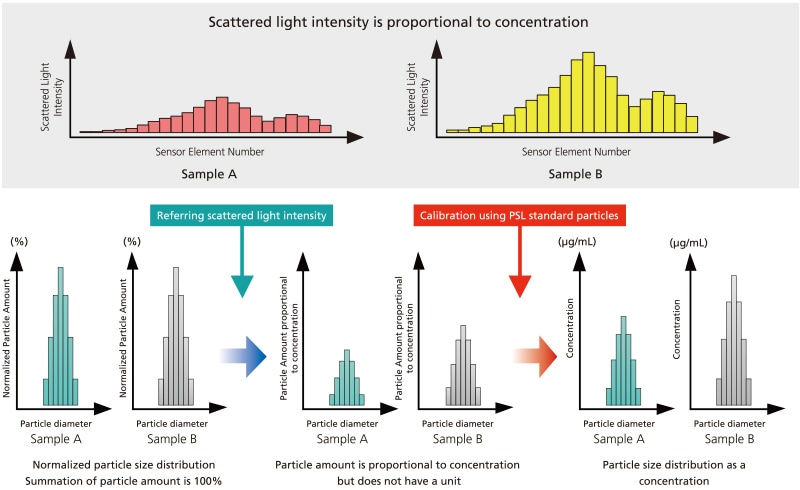
The difference between sample A and sample B cannot be evaluated by particle size analysis using a normalized particle amount whose summation is 100%.
By referring to scattered light intensity, the particle amount becomes proportional to concentration but does not have a unit. Via calibration using a PSL (polystyrene latex) standard particle, we can obtain particle size distribution as a concentration.
Principle of the Laser Diffraction Method by Violet Laser
There is a one-to-one correspondence between the particle diameter and the light intensity distribution pattern
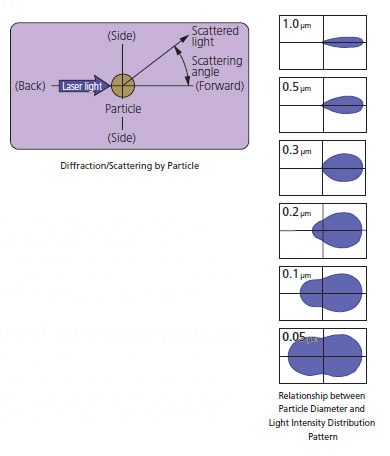
When a particle is irradiated with a laser beam, light is emitted from the particle in every direction. This is “scattered light”. The intensity of the scattered light varies with the scattering angle and describes a spatial intensity distribution pattern, known as a “light intensity distribution pattern”. If the particle diameter is large, the scattered light emitted from the particle is concentrated in the forward direction (i.e., the direction of the laser beam), and fluctuates intensely in an angular range too small to be represented in a diagram. Compared to the light emitted in the forward direction, the intensity of all other light is extremely low.
As the particle diameter becomes smaller, the pattern of the scattered light spreads outwards. As the particle becomes even smaller, the intensity of the light emitted to the side and backwards increases. The light intensity distribution pattern becomes gourd-shaped and spreads out in every direction. Therefore, there exists a one-to-one correspondence between the particle diameter and the light intensity distribution pattern. This means that the particle diameter can be ascertained by detecting the light intensity distribution pattern.
Violet laser allows accurate measurements of ultra-small particles
The light intensity distribution pattern varies little relative to the particle size distribution when the particle size drops to several tens of nanometers. This is the reason for the minimum limit of detection of the laser diffraction method. A violet laser creates clearer differences in the light intensity distribution pattern at ultra-small particle sizes than a red laser. Consequently, a violet laser is used to enhance the measurement performance for ultrafine particles of the order of several tens of nanometers.
Measurement is performed on particle groups
Particle size distribution measurement is not performed on individual particles, but on particle groups made up of a large number of particles. Particle groups contain particles of different sizes, and the light intensity distribution pattern emitted by a group is composed of all the scattered light emitted from all the individual particles. The particle size distribution, in other words, what particle sizes are present in what proportions, can be obtained by detecting and analyzing this light intensity distribution pattern. This is the basic principle behind the laser diffraction method.
Optical System in Aggregates Sizer
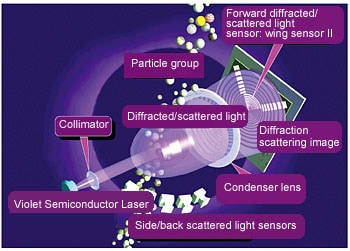
The laser beam emitted from the light source (semiconductor laser) is converted into a thick beam with a collimator, which is directed at the particle group. The scattered light emitted from the group in a forward direction at up to a 60° angle is concentrated with a lens, and concentric scattering images are formed at a detecting plane positioned at a distance equal to the focal length. This is detected with the wing sensor in which light-receiving elements are arranged concentrically. The scattered light emitted to the side and backwards is detected with side and back-scattered light sensors. The light intensity distribution data can be obtained by detecting scattered light data.
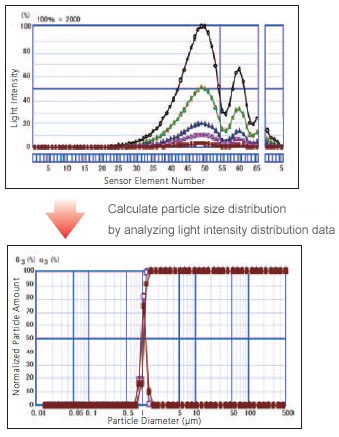
Overall Flow of Light Intensity Detection and Data Processing
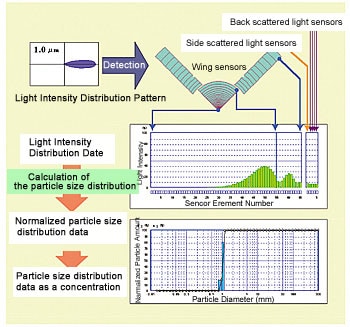
With the Aggregates Sizer, particle size distributions are calculated using the light intensity distribution data. The overall flow of detection and data processing is shown in the diagram to the left. In measurement, the whole range of operations from the detection of scattered light intensity distribution patterns to the calculation of the particle size distribution is executed as one process, and the particle size distribution data is output. Previously, particle size analysis by laser diffraction method could only obtain a normalized particle amount whose summation is 100%. Particle size analysis by Aggregates Sizer can obtain a concentration (Unit:μg/mL) by referring scattered light intensity according to calibration using PSL standard particles.
Particle sizes from 100 nm to 10 µm can be measured with a single system
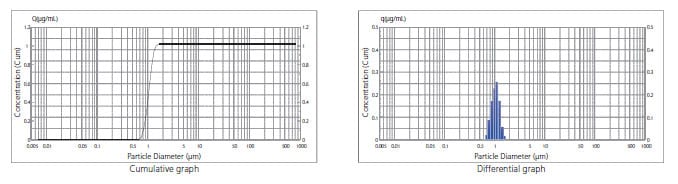
Particle concentrations (µg/mL or particles/mL) can be evaluated quantitatively using WingSALD bio, special software for the Aggregates Sizer.
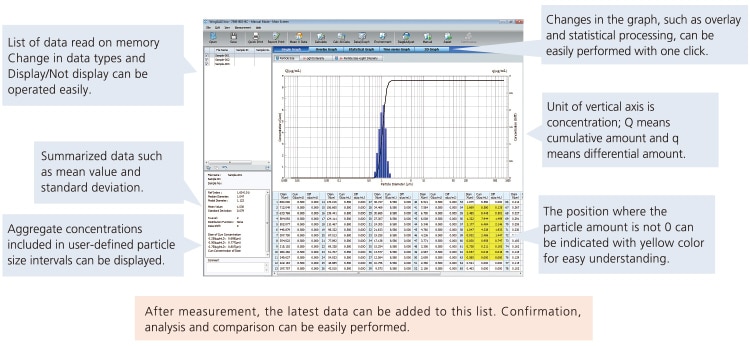
Cumulative graphs are displayed with polylines. These indicate the total cumulated amount of particles equal to or smaller than the particle size shown on the horizontal axis, representing this as a numerical value Q (µg/mL or particles/mL) on the vertical axis.
Differential graphs are displayed with histograms. These indicate the amount of particles contained in the particle size range shown on the horizontal axis as a numerical value q (µg/mL or particles/mL) on the vertical axis.
High linearity of concentration
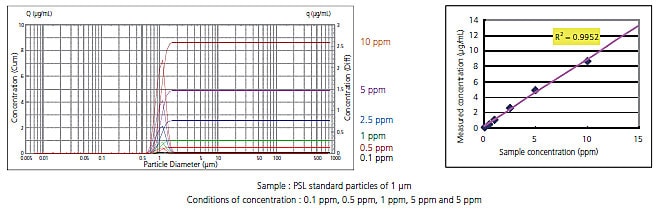
Vertical axis indicates the measured concentrations by Aggregates Size and horizontal axis indicates concentration as measurement conditions of 0.1 ppm, 0.5 ppm, 1 ppm, 5 ppm and 5 ppm. This graph shows good linearity of concentration measurement by Aggregates Sizer.
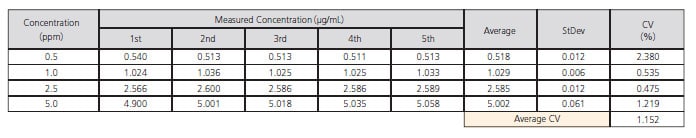
High repeatability
The stable optical system used with the laser diffraction method enables accurate detection of scattered light.
The following table shows measurement results using a PSL standard particle of 1 μm, changing the concentration conditions (0.5 ppm, 1 ppm, 2.5 ppm and 5 ppm) to confirm the repeatability. CV values for all conditions are less than 3%.
High resolution – Detect multiple peaks accurately
The intensity of scattered light from large particles is high and changes frequently within the forward small angle. In contract, the intensity of scattered light from small particles is very low and changes slowly within the large angle.
Aggregates Sizer uses Wing sensor II, which consists of 78 concentric sensor elements, and the area of the respective element can increase logarithmically from center to outer. Therefore, Wing sensor II can effectively detect the scattered light intensity pattern of a wide particle size range, enabling high resolution.
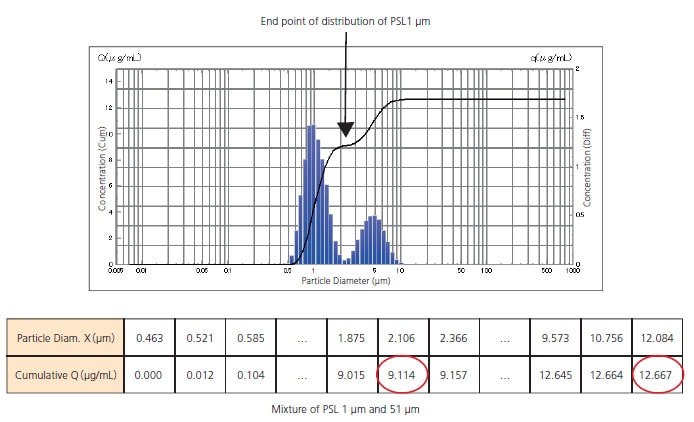
From this graph and table, we can determine that the concentration of PSL 1 μm is 9.114 μg/mL and that of PSL 5 μm is 3.553 μg/mL, which can be calculated by subtracting 9.114 from total value of 12.667 μg/mL.
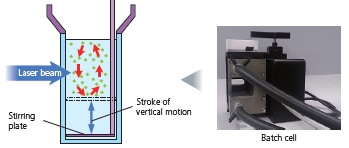
Temperature Control Function
The Aggregates Sizer aggregation analysis system for biopharmaceuticals now includes a temperature controlled cell unit. Consequently, aggregates can be measured without temperature variations affecting the formation of aggregates, even for mechanical stress testing, which takes longer than regular measurements due to the batch cell stirring function involved. In addition, the micro cell size was reduced from 400 μL to 125 μL so that smaller sample quantities can be measured.
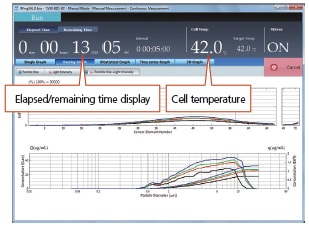
Aggregate Formation Process Can Be Determined More Quickly with an Improved Continuous Measurement Function
With the continuous measurement function, up to 200 data points can be measured successively (changes over time) at intervals as short as 30 seconds. During measurements, the system can display a real-time particle size distribution from current measurement data, in addition to the elapsed time and remaining time, and start processing the data measured thus far. This results in a quicker understanding of the aggregate formation process.
The system includes a refrigerated/heated circulator that can be used to keep the sample at a constant computer-controlled temperature within the 20 to 42°C range (with a temperature accuracy of ±1°C).
Consequently, aggregates can be evaluated under constant-temperature conditions, so that aggregate formation is not affected by any temperature changes.
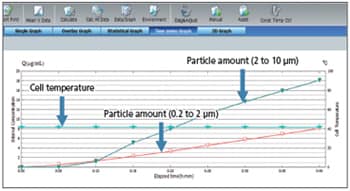
Polysorbate not added
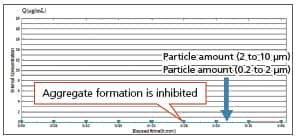
Polysorbate added
| Sample | Bovine gamma globulin |
| Solution | Phosphate buffer (pH 7.4, with 150 mM NaCl) + polysorbate-20 |
| Sample Concentration | 1 mg/mL |
| Conditions | Stirred with stainless steel stirring rod (at 5 minute intervals for 40 minutes at constant 25°C temperature) |
Cell Volume Reduced to 125 μL
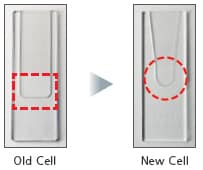
The amount of sample required was reduced from 400 μL to a low 125 μL by eliminating as much of the sample that does not affect measurements as possible. In addition, the micro cell material was completely changed to quartz glass, so that the cells can be cleaned chemically (alkaline) or ultrasonically.
Additional Software Functions Can Be Used to Obtain Necessary Information Quickly
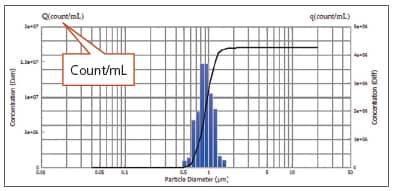
Display Concentration in Terms of Count (count/mL)
In addition to the mass concentration values displayed on previous models (μg/mL),concentration can now also be displayed in terms of number of aggregates per milliliter (count/mL).
Evaluate Aggregate Quantities within Any Specified Particle Size Range
Data can be displayed for the same particle size intervals as used for current techniques (such as for particle size counters). It also can be used to evaluate the particle quantities in specific particle size intervals required by regulations and standards expected to be established in the future.
Specifications
| Aggregates Sizer with Temperature Control Function | |
| Batch Cell Unit (with Temperature Control Function) | |
| Cell Material | Quartz glass, PTFE (funnel/cap) |
| Required Liquid Volume | Approx. 5 mL |
| Stirrer Mechanism | By vertical motion of stirring plate |
| Stirring Plate Material* | Stainless steel, glass, PEEK |
| Micro Cell Unit (with Temperature Control Function) | |
| Cell Material | Quartz glass, PTFE (cap) |
| Required Liquid Volume | 125 μL |
| Temperature Range | 20 to 42°C, constant temperature |
| Temperature Control Accuracy | ±1°C |
| Operating Environment | Temperature: 10 to 30 °C, Humidity: 20 to 80 % |
| Refrigerated/Heating Circulator | |
| Manufacturer | JULABO |
| Model | F25-ME |
| Computer Control | RS-232C connection |
| Dimensions and Weight | W230 mm x D420 mm x H610 mm, 31 kg |
| Required Power Supply | 100 V AC, 13 A, 50/60 Hz |
* The system includes three types of batch cell stirring plates made of three different materials (stainless steel, glass, and PEEK) commonly used for preparing or storing biopharmaceuticals.