This article was published in J. Chrom A, 1469, Arase, et.al., 35-47, Copyright Elsevier (2016).
LabSolutions LCGC - Features
Integrated Workstation
Peak Integration Algorithm
The time required to analyze large quantities of data obtained from the increasingly quick analyses and increasingly prevalent simultaneous multicomponent analyses in recent years has become a challenging issue. In addition, the strengthening of regulations associated with data integrity has given rise to demands for automated and simplified manual methods for integrating the areas of problematic chromatogram peaks. Herein, we introduce a new peak integration algorithm for LabSolutions, i-PeakFinder, which is designed to resolve these issues. i-PeakFinder, a new peak integration algorithm for LabSolutions, is a completely automated integration function that can detect peaks with high levels of accuracy without requiring special parameter adjustments. In addition, this algorithm has adjustable parameters that allow the integration function to be applied to a wide range of complex chromatogram patterns. Furthermore, the adjustable parameters allow to output highly accurate peak integration results from large quantities of data, even for batch analysis.
Features of i-PeakFinder
With Shimadzu's traditional peak integration methods or competitor methods, some complex chromatograms require time programming in addition to the typical parameter adjustments for peak integration. However, i-PeakFinder can perform peak integration of these chromatograms just with simple parameter adjustments. This peak integration function has the following features:
- Highly accurate detection of shoulder peaks
- Simple adjustment of peak-baseline processing
- Improved peak-baseline positioning that results in improved reproducibility
- Performing accurate peak integration even with variabilities caused by baseline drift
Shimadzu also emphasizes on compatibility, so LabSolutions can also be used with the traditional peak integration methods (Chromatopac mode). Switching between the traditional peak integration and i-PeakFinder methods during analysis is easy, allowing the user to select an appropriate peak integration method for the circumstances. This includes selecting a traditional method for compatibility with past data. Fig. 1 shows examples of using the completely automated integration function to analyze typical peaks.
Highly Accurate Detection of Shoulder Peaks
i-PeakFinder can accurately detect shoulder peaks. In cases wherein manual peak integration is required to distinguish and detect the shoul-der and main peaks using traditional peak integration methods, i-Peak-Finder can automatically detect shoulder peaks while maintaining consistent peak detection sensitivity throughout the entire chromatogram. In general, it is difficult to automatically detect considerably small shoulder peaks, as shown in Fig. 2; however, i-PeakFinder can even detect such peaks automatically based on the threshold judgment.

Fig. 1 i-PeakFinder's Completely Automated Integration Function

Fig. 2 Examples of Shoulder Peak Detection
Simple Adjustment of Peak-baseline Processing
Accurate detection of impurity peaks is essential for pharmaceutical quality control and other applications. Impurity peaks are often fused at the base of a major peak, and quantitative results obtained via area normalization can vary depending on the method used for peak-baseline processing. The method used for peak-baseline processing also differs based on the samples and testing objectives. With traditional methods, performing a specific type of peak-baseline processing requires the user to include time programming or perform peak integration manually.
However, i-PeakFinder has adjustable parameters in its basic settings for performing a specific type of peak-baseline processing, allowing the user to easily implement the optimum peak-baseline type in each situation. Fig. 3 shows a list of peak-baseline type in the settings window, Fig. 4 shows the result of peak-baseline type setting of an impurity peak that is fused at the base of a major peak, and Table 1 summarizes the quantitative results obtained via area normalization with different peak-baseline type settings. Peak-baseline processing appropriate for a particular situation can be simply performed by changing a few basic parameters.

Fig. 3 Peak-baseline Type Settings

Fig. 4 Peak-baseline Processing Example
Table 1: Quantitative Results Obtained via Area Normalization with Different Methods of Peak-baseline Type
| Not configured | Vertical Division | Base to Base | |
|---|---|---|---|
| Main peak | 99.681 | 99.448 | 99.680 |
| Impurity | 0.160 | 0.338 | 0.160 |
Basic Peak Detection Parameters
The basic parameters that allow the user to adjust peak detection conditions are the peak-baseline type mentioned above, peak detection threshold, and peak integration range. Using the detection threshold setting, the peaks below a certain threshold are not detected based on the estimated noise level calculated using a proprietary algorithm. Decreasing the peak detection threshold value allows the detection of smaller peaks. The peak integration range specifies the time range during which peaks will be detected. Fig. 6 shows the change in results produced by changing the peak detection threshold from the default setting of 5 to 2,000. These intuitive controls allow the user to detect or not to detect small peaks with a simple adjustment. Fig. 7 shows an example of adjusting the peak integration range. Without adjusting the peak integration range, all peaks fall within the range and the peak-baseline is affected by negative peaks. Setting the peak integration range to exclude negative peaks allows the user to configure an appropriate baseline.
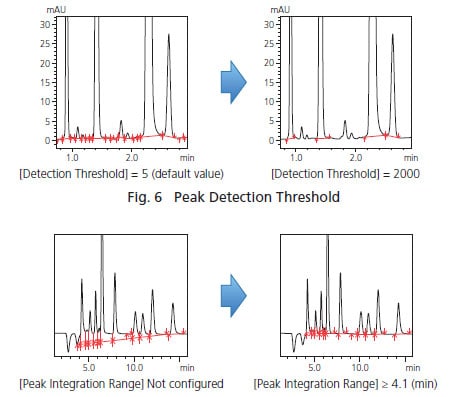
Fig. 7 Peak Integration Range
Detailed Peak Detection Settings
For complex chromatograms, adjustments of the detection threshold, peak integration range, and peak-baseline type may not be enough to obtain the desired peak integration results. i-PeakFinder is compatible with a wide variety of chromatograms and allows the user to configure more detailed peak detection conditions. Some of these detailed settings are described below:
(1) To Detect Peaks Not Affected by Noise [Minimum Half Width]
Smoothing is sometimes performed on chromatograms obtained via LCMS. If the noise frequency is close to the peak frequency, then it becomes difficult to determine peaks automatically and single peaks may be recognized as multiple peaks. In this situation, configuring the minimum half width setting ignores noise smaller than that value and ensures that peaks with a FWHM value above the set minimum value are detected among the peaks with a wide wave profile due to smoothing. Fig. 8 shows the difference made by increasing the minimum FWHM value. This feature is useful when noise can be observed in a peak.

Fig. 8 Example Configuration of Minimum FWHM
(2) To Ensure Peak Area Accuracy and Linearity [Peak Baseline Height]
With tailing peaks and chromatograms with a large amount of baseline noise, the peak start and end points can vary depending on the data, which can reduce area accuracy. By using the peak-baseline height setting, the peak start and end points are recognized as the product of a value entered for peak-baseline height and noise intensity calculated using a proprietary algorithm. Consequently, the larger the peak-baseline height value is, the higher the peak-baseline is positioned.
Using this setting provides good reproducibility in the determination of peakbaseline start and end points. Fig. 9 shows an example configuration of peak-baseline height where the baseline length of the tailing peaks is adjusted by specifying the peak-baseline height.

Fig. 9 Example Configuration of Peak-Baseline Height for Tailing Peaks
(3) To Avoid Recognizing Long-Period Undulations as Peaks [Maximum Half Width]
The maximum half width, which is the opposite of the minimum half width, is a parameter that can be specified to ignore larger peaks as baseline undulations. For example, Fig. 10 shows baseline drift appearing as a large baseline bulge that could be recognized as a peak. This undulation can be removed by specifying a maximum FWHM.

Fig. 10 Example Configuration of Maximum FWHM
(4) To Unify Fused Peaks into a Single Peak [Unify Peaks by Separation Width]
The minimum half width setting is used to avoid mistakenly recognizing noise as peaks, while the unify peaks by separation factor setting is used to combine fused peaks into a single peak. Fig. 11 shows three fused peaks. Configuring this setting will unify the two side peaks into the larger peak. Note that this setting is only effective for baseline intervals containing fused peaks.

Fig. 11 Example of Unifying Unresolved Peaks
(5) To Decide Whether to Recognize Shoulder Peaks [Unify Peaks by Shoulder Ratio]
When impurities were fused as shoulder peaks at the base of a main component peak, the traditional peak integration method required time programming or manual peak integration to detect the shoulder peak. i-PeakFinder allows easy detection of shoulder peaks and also allows the user to decide whether to recognize (or not) impurity peaks based on a threshold ratio of the main component peak height to the shoulder peak tangential height. Fig. 12 shows an example of shoulder peak detection implemented without time programming or manual peak integration and an example of using the threshold value to unify the shoulder peak with the main component peak. Configuring a threshold value can also be used as a condition for deciding whether to recognize impurity peaks.

Fig. 12 Example of Setting a Threshold for Recognizing Shoulder Peaks
User interface connecting smart devices to LabSolutions software(Direct)
LabSolutions Direct is a new remote access tool for the LabSolutions series that enables control and monitoring of HPLCs from a commercially-available smartphone or tablet PC via a simple user interface. LabSolutions Direct makes it possible to turn ON/OFF HPLC's solvent delivery unit or oven, start analysis, and monitor chromatograms. Thus, analysis can now be performed while checking instrument status from remote environments.
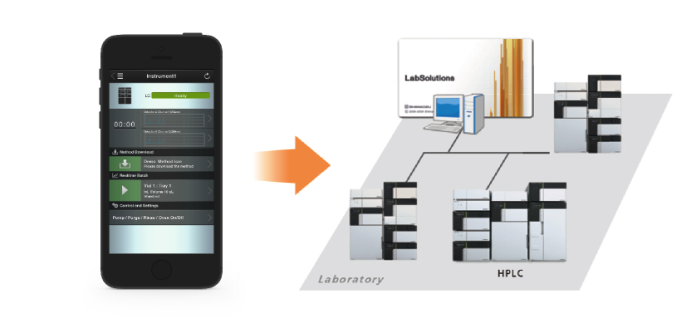
Directly access the HPLC in a laboratory from a smartphone or tablet PC.
Direct Access to the Instrument from a Mobile Environment
The HPLC connected to LabSolutions can be directly accessed from a commercially-available smartphone or tablet PC simply by adding on a wireless LAN router. This allows the instrument to be controlled and monitored from remote locations. LabSolutions Direct supports the series of analysis operations, including selecting methods used for analysis, turning ON/OFF the pump and column oven, data acquisition, and monitoring chromatograms or instrument status. No special software is required; the only thing needed is a Web browser. So, anybody can operate LabSolutions Direct with ease.

System Configuration Example
Perform Analysis Easily with Simple Operations
LabSolutions Direct supports customers with visually easy-to-follow screens for the various operations, including the selection of methods, instrument control, data acquisition and monitoring of chromatograms. All of the functions required for remote operation are organized in an easy-to-follow manner on compact screens in such a way that they can be used with the same look and feel as smartphone or tablet PC applications.
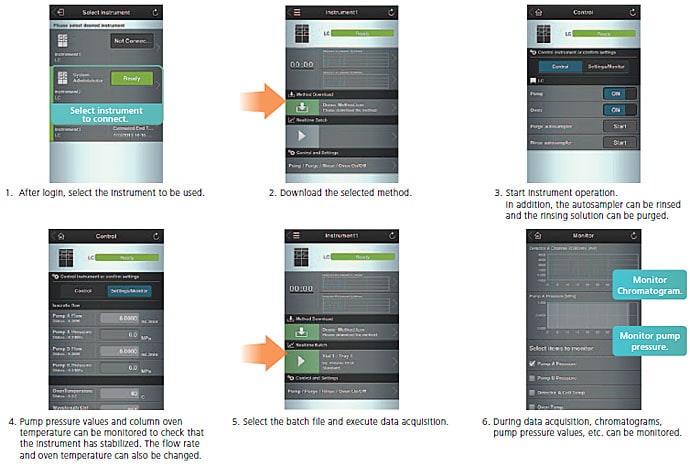
Seamless Linking with LabSolutions
Method files or batch files created and managed on LabSolutions are read to LabSolutions Direct and executed to acquire data. The acquired data is automatically saved for a PC so it can be analyzed using LabSolutions.
By connecting to LabSolutions, where methods, batch files and data are managed centrally, LabSolutions Direct provides a seamless remote access environment.
* LabSolutions Direct supports control/monitoring of HPLCs in LabSolutions LC/GC.
Intelligent Peak Deconvolution Analysis (i-PDeA II)
What Is i-PDeA? – An Introduction Through Application Examples –
Intelligent Peak Deconvolution Analysis (i-PDeA) is a data analysis technique that extracts a single peak from co-eluted peaks and quantitates it by exploiting the differences in spectra between each compound.
i-PDeA II enables users to visualize and detect a minor single impurity even when the impurity is co-eluted with an analyte. It also facilitates the separation of hard-to-separate peaks on the column through computer processing and deconvolution of the spectrum information, which reduces the effort required to investigate separation parameters.
The following highlights some benefits of i-PDeA II through application examples.
Example 1: I have developed an ultrafast analysis method, but want to further reduce analysis time. However, shortening the analysis time would affect separation.
When you apply i-PDeA, you can selectively visualize only the components you want to view, even peaks that are not separated!
-
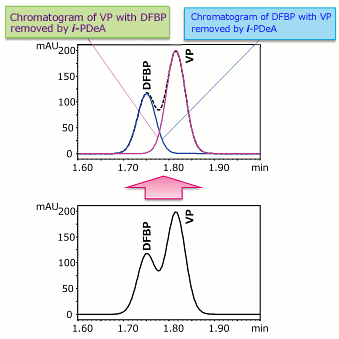
Using i-PDeA, the VP and DFBP Peaks Can Be Separated!
(DFBP: Difluorobenzophenone, VP: Valerophenone) -
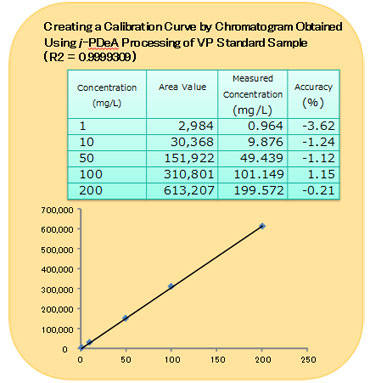
A Calibration Curve Created Using i-PDeA for the VP Standard Sample
Example 2: I want to correctly quantify the impurities that are eluted in the tailing of the main component peak.
With i-PDeA, no additional consideration of separation conditions is required! Quantitative calculation can be done directly!
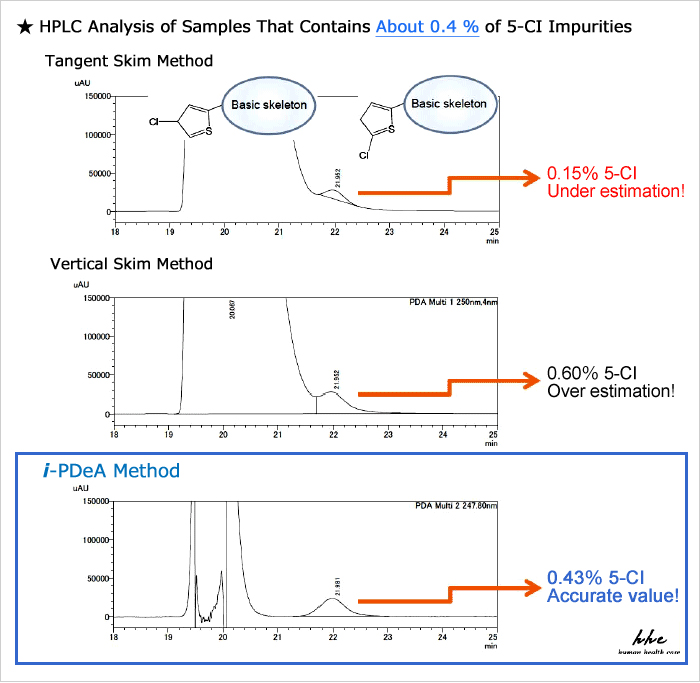
These materials were provided by Mr. Kanta Horie, Global Formulation Research, Pharmaceutical Science & Technology, Eisai Co., Ltd.
Compared to existing peak integration methods such as tailing (tangent skim method) and vertical separation (vertical skim method), i-PDeA permits quantitative calculation of impurities with higher precision!
Example 3: Separation of position isomer compounds fails to work well.
Achieve separation using i-PDeA even though the spectral patterns are similar
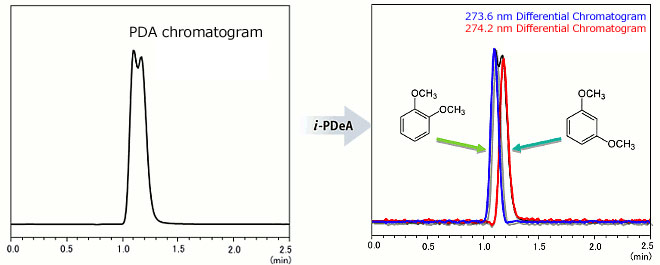
Separation of 1,2-Dimethoxybenzene (274.2 nm wavelength) and 1,3-Dimethoxybenzene (273.6 nm)
Even though the difference in absorption wavelength between 1,2-dimethoxybenzene (274.2 nm wavelength) and 1,3-dimethoxybenzene (273.6 nm) is only 0.6 nm, the individual chromatograms can be obtained!


