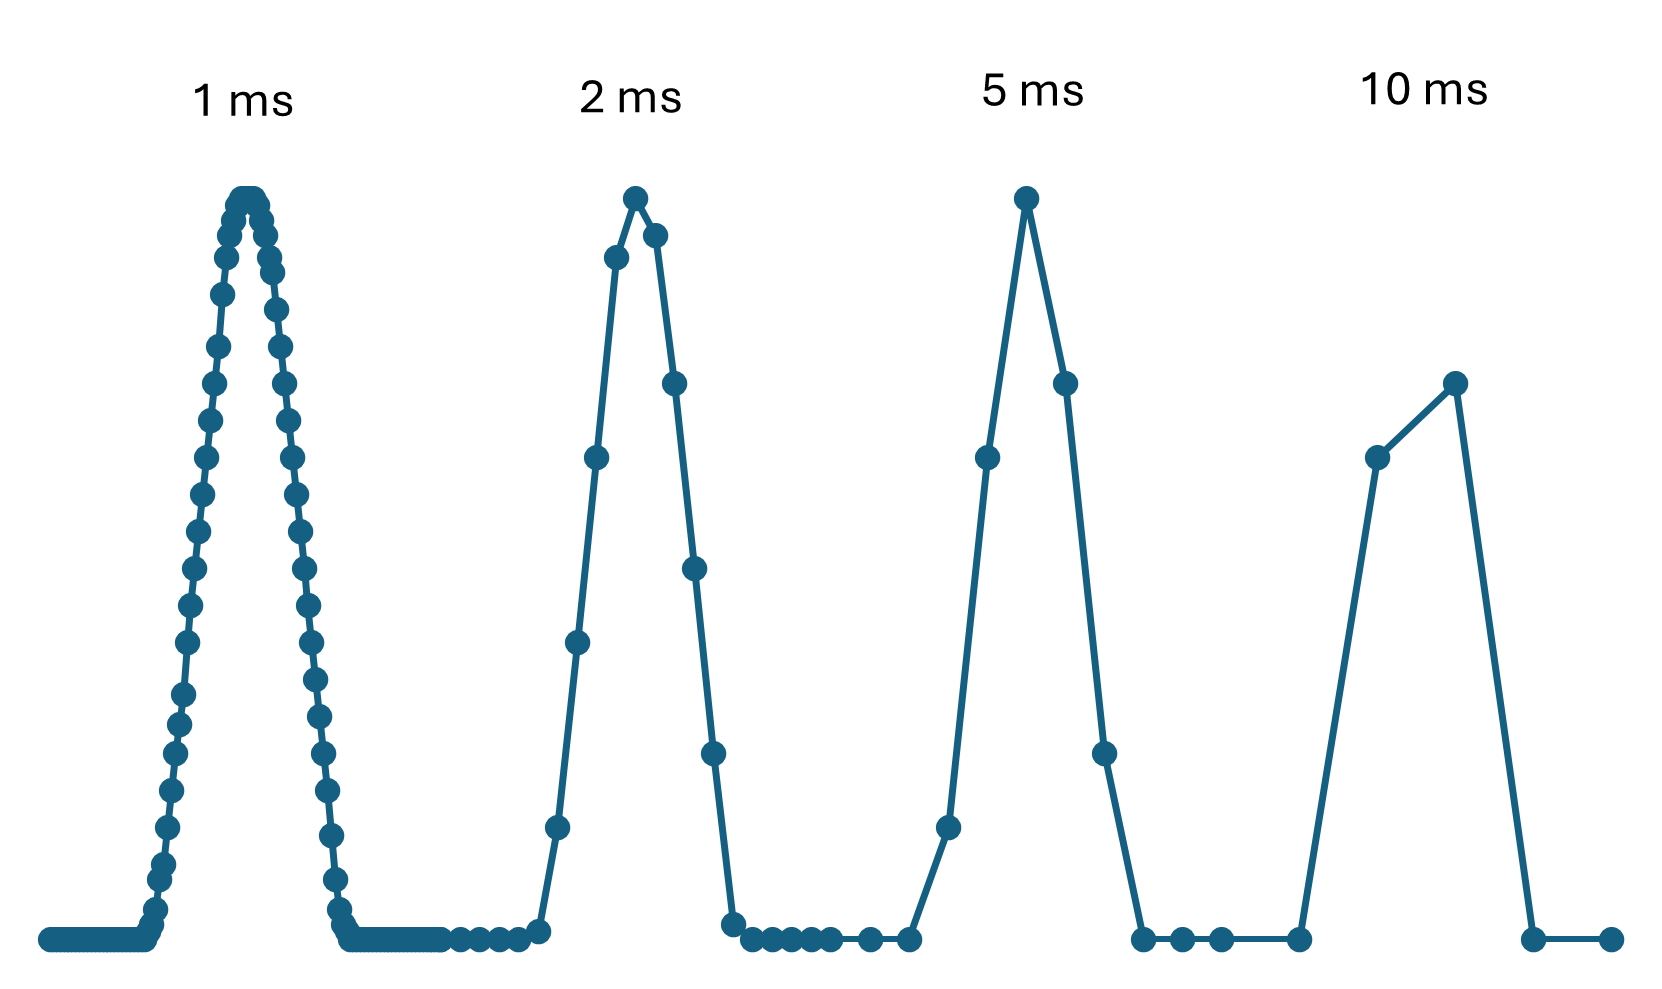
Fig. 2 Example of improved peak description with more data points as dwell time increases
LCMS Troubleshooting Course
1 - Basics of LCMS Systematic Troubleshooting
2 - Preventive Maintenance Measures
5 - Changes in Peak Shape - Part 1
6 - Changes in Peak Shape - Part 2
7 - Ghost Peaks
8 - Peak Area Fluctuations
9 - Baseline Disturbances
10 - Retention Time Fluctuations - Part 1
11 - Retention Time Fluctuations - Part 2
12 - Changes in Chromatographic Resolution
13 - Changes in MS Response
14 - Undesired Fragmentation & Ion Source Settings
15 - Course Summary & Quiz
Achieving good peak shape is essential for accurate quantitation and reliable identification in LCMS. Distorted peak shapes not only indicate chromatographic issues but can also signal problems affecting ionisation and MS detection (e.g., ion suppression, detector saturation).
This topic is divided into two parts:
In LCMS, the sample solvent must be compatible with both the LC separation and MS ionisation process.

Fig. 1 Visualisation of the sandwich injection
Excessive injection volumes can overload the column and ion source, distorting peaks and reducing MS signal stability.
A frequently neglected point is data acquisition. However, this has a significant impact on the quality of chromatograms and should therefore always be adapted to the respective chromatography. A representation of different data acquisition times is shown in Fig. 2, varying from 1 to 10 ms. The 1 and 2 ms acquisition settings adequately describe the peak shape. The 5 ms acquisition rate begins to poorly describe the peak and is quite angular which could impact on quantitation. The 10 ms results insufficiently describes the peak and misses significant portions of the peak. Fig. 3 also illustrates the variability which could be expected if insufficient data points are collected.
Peaks with a low data acquisition rate are not sufficiently described due to too few data points. This can lead to strong peak area fluctuations, as no data point can lie at the peak maximum with slight fluctuations. But too high a data acquisition rate can also have a negative effect, such as the noise increasing and fewer compounds which can be detected in a given time frame.
Fig. 2 Example of improved peak description with more data points as dwell time increases
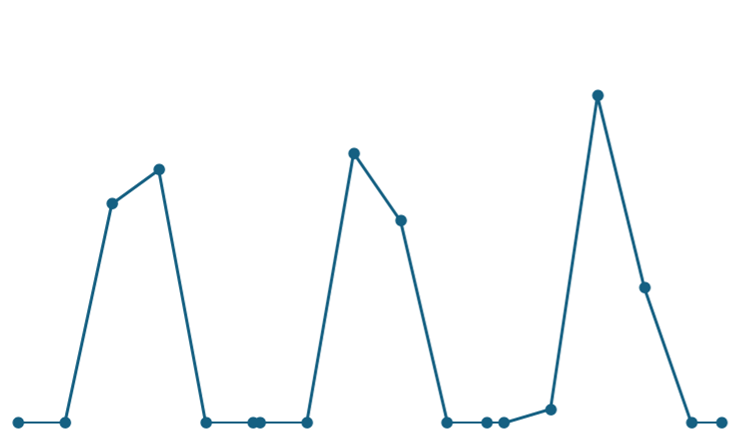
Fig. 3 Illustration of the variability of peak area when using a low dwell time (10 ms)
Another setting option is the response of the detector. If the response is set too high, the peaks are artificially broadened. If it is set too low, the peak becomes narrower but the noise increases.
Unfortunately, there are no standard values for the data acquisition rate and the response of the detector. They should always be adapted to the application's chromatography. As a guideline, it should be as fast as possible with an acceptable signal-to-noise ratio.
In the next course unit, we will continue to look at the causes of peak shape changing, specifically for peak fronting, tailing, broadening and splitting.
Your Shimadzu LCMS Team
Watch short videos explaining analytical intelligence features of Shimadzu HPLC systems